


Understanding Traffic Sources Using Google Analytics
![]()
Justin Matthew
You don’t have to be a born statistician or a mathematician to understand the importance of Google Analytics. Many of us install the code snippet into our websites at the suggestion of others, but don’t really know what we’re looking at, why we’re looking at it, or the importance of the figures in front of us.
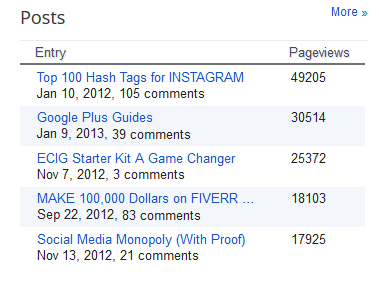 |
| Here are 5 posts from This blog and page views |
Today, I want to bring up a key point about your traffic sources and how important the information actually is. It extends beyond just daily unique visits. If you look at your website figures close enough, you can almost hear Google whispering advice on how to get higher quality traffic. No, really.
Traffic Sources
Your traffic sources may be the best way to determine the effectiveness of your campaigns. Even better, the numbers will give you some insight as to where you should allocate most of your efforts. Here’s a quick screenshot of the traffic sources for one
of my many blogs. 
The experienced users will be able to see some good and bad things about the numbers above. Note the rows I’ve highlighted.
If all I cared about were visits, then you would probably tell me to focus all my efforts on Pinterest, and it makes sense.
Pinterest is responsible for bringing 9,009 people to my website, but there’s more to the picture here. Take a look at the bounce rate from my Pinterest referrals. It’s currently sitting at 93.33%.
Bounce Rate – Represents the percentage of visitors who enter the site and “bounce” (leave the site) rather than continue viewing other pages within the same site. –Wikipedia
Suddenly Pinterest isn’t looking so hot, and it could be for various reasons.
My site contains lengthy articles, and that’s basically it. Pinterest users are primarily concerned with visually stimulating imagery, so when they click a link to my website and find out they’ve just crash-landed on a 1,200 word article, they back out. You can tell most of them back out quickly, too. Average visit duration is low at only 25 seconds. This is Google’s way of telling me to focus my attention elsewhere.
Now, this doesn’t mean Pinterest users hate reading. It just means they would rather pin images, instead. I don’t take offense to that.
Here’s another example from the traffic sources chart: I frequently share my articles on Google Plus, and it seems to be an effective strategy. Although it’s not in the same atmosphere as Pinterest in terms of the volume it’s generated for me (155 visits versus 9,009 visits), it’s higher quality traffic for my purposes. Let me explain.
For my Google+ shares, the bounce rate is hovering around average at 54.19%, much improved over the 93.33% I was getting from Pinterest. The average visit duration is also much higher at 3 minutes and 49 seconds, over 9 times greater than what I was receiving from my Pinterest clicks. Even better, 61.94% of the users are new visits.
You always want new visits, and Pinterest was showing 98.12% under new visits, but the lower percentage means that I’m actually getting some return visits from Google Plus. Return visits are a good thing. That means people like the content!
More on Google Analytics in future write-ups. Don’t forget to look at your traffic sources!
We represent multiple major corporations and they are available for references. [email protected]
www.ownsocialmedia.com
www.monopolizesocialmedia.com
https://www.facebook.com/MonopolizeSocialMedia
https://plus.google.com/u/0/+JustinMatthewSocialMedia/posts
https://plus.google.com/u/0/+Monopolizesocialmedia/posts


